Phase Plot and Phase Portrait
Thu 23 July 2020 by Pranabendra Prasad ChandraPhase Plot and Phase Portrait
Using Simulink® and MATLAB®
Contents
- ODE
- Simulink Model
- Defining the state equation
- Phase plane
- Calculating gradient and plotting the vector field
- Check for different initial conditions
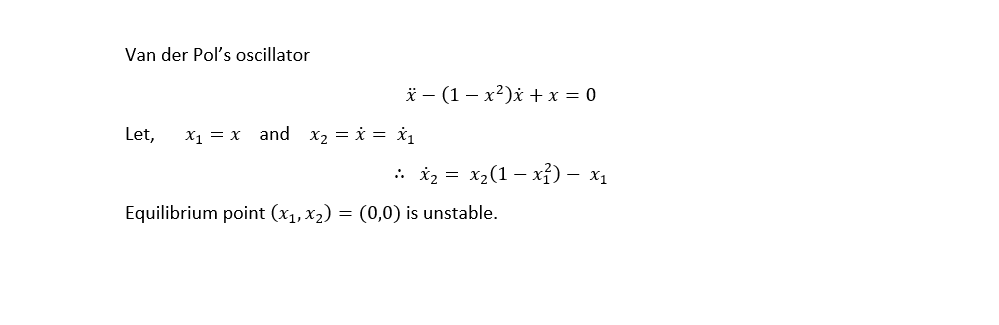
ODE
imshow('VDP.png')
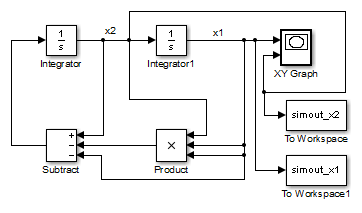
Simulink Model
close
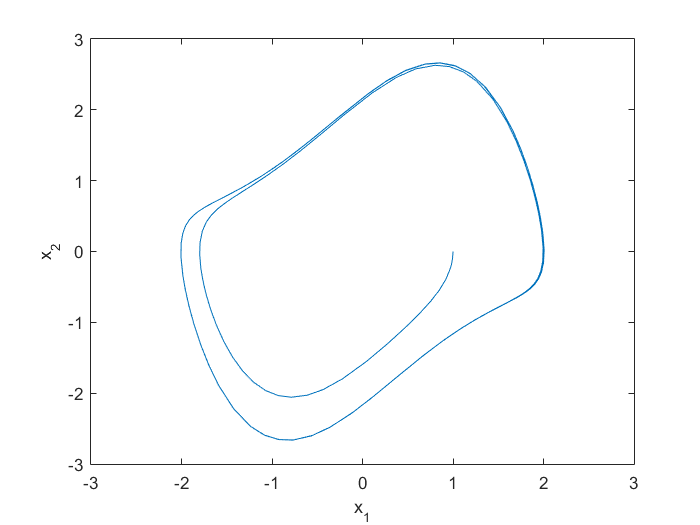
% Assuming initial condition = (1,0)
open_system('van_der_pol_model')
fprintf('\n')
plot(simout_x1.data, simout_x2.data)
xlim([-3 3])
xlabel('x_1')
ylabel('x_2')
Defining the state equation
f = @(t,X) [X(2); X(2)*(1 - X(1)^2) - X(1)];
Phase plane
x1 = linspace(-5,5,20);
x2 = linspace(-5,5,20);
[x,y] = meshgrid(x1,x2);
Calculating gradient and plotting the vector field
u = zeros(size(x));
v = zeros(size(x));
t=0;

for i = 1:numel(x)
    Xdot = f(t,[x(i); y(i)]);
    u(i) = Xdot(1);
    v(i) = Xdot(2);
end

quiver(x,y,u,v,'r'); figure(gcf)
xlabel('x_1')
ylabel('x_2')
axis tight equal;
hold on;
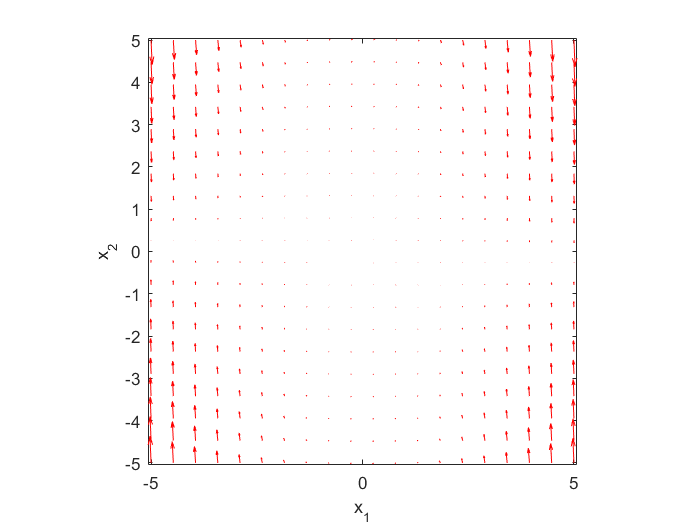
Check for different initial conditions
for y20 = -4:2:4
    [ts,ys] = ode45(f,[0,20],[0;y20]);
    plot(ys(:,1),ys(:,2))
    plot(ys(1,1),ys(1,2),'x')
end

for y10 = -4:2:4
    [ts,ys] = ode45(f,[0,20],[y10;0]);
    plot(ys(:,1),ys(:,2))
    plot(ys(1,1),ys(1,2),'x')
end
hold off
